
Should UK Landlords Sell in 2026? A Portfolio Decision Framework

Time to read: 22 minutes
The question of whether should UK Landlords Sell in 2026 does not have a single answer. It depends on three variables that differ across every portfolio: tax position, property quality, and ownership structure.
What has changed is the context in which the decision is being made.
Key takeaways
Three developments are converging in 2026. The Renters’ Rights Act comes into force on 1 May. Making Tax Digital for Income Tax becomes mandatory from 6 April for landlords with gross income above £50,000. And Section 24 tax restrictions, now fully phased in, are compressing net returns for higher-rate taxpayers holding mortgaged properties in personal names.
None of these changes makes the answer obvious. Some landlords should sell. Others should hold. Most portfolio landlords will find that the clearest position sits between those two points: rationalise rather than retreat.
This insight provides the framework for making that decision property by property.
The Regulatory and Financial Context for 2026
Understanding the sell-or-hold question requires an honest assessment of what has changed structurally, not just what appears in the headlines.
Section 24 and net returns
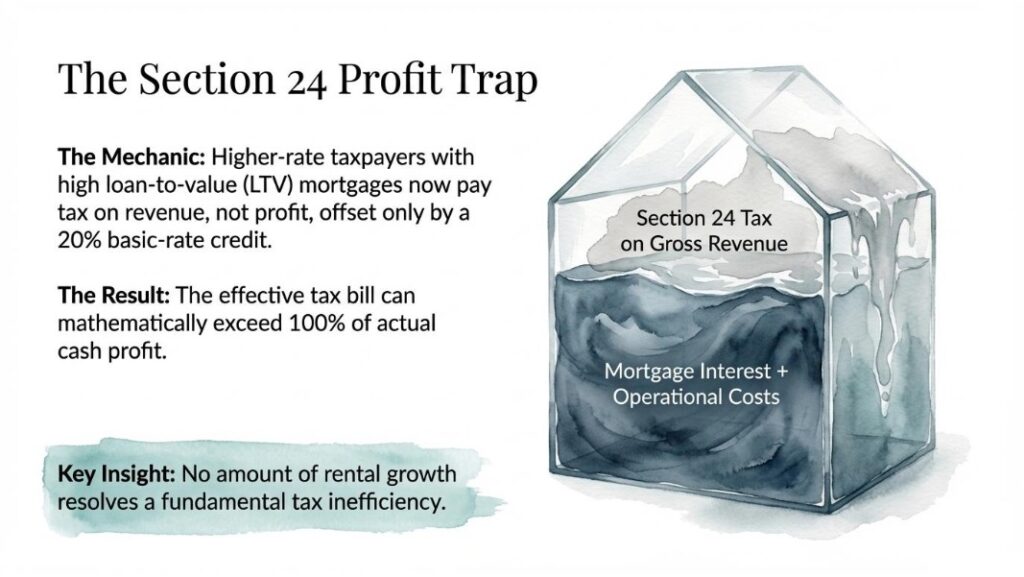
Section 24 is compressing net returns for some landlords significantly. Under Section 24 of the Finance Act 2015, individual landlords can no longer deduct mortgage interest from rental income before calculating their tax liability. Instead, they receive a 20% basic-rate tax credit. For basic-rate taxpayers, the effect is broadly neutral. For higher-rate and additional-rate taxpayers holding mortgaged properties in personal names, the impact is material.
A higher-rate taxpayer with £20,000 in rental income and £10,000 in mortgage interest previously paid tax on £10,000 profit. Under Section 24, they pay tax on £20,000, offset only by a £2,000 credit. The effective tax bill increases from £4,000 to £6,000 on the same cash position. For landlords with high loan-to-value mortgages, this can push the effective tax rate above 100% of actual cash profit.
Capital gains tax
Capital gains tax rates have shifted in the landlord’s favour. The October 2024 Autumn Budget reduced the higher-rate CGT on residential property from 28% to 24%, with the basic rate remaining at 18%. This represents a meaningful saving on disposal: approximately £4,000 per £100,000 of taxable gain for a higher-rate taxpayer. However, the annual CGT exemption has been reduced to £3,000, meaning more of each gain is now taxable. Many tax advisors have characterised the current CGT position as a disposal window that may not persist under the current fiscal environment.
The Renters’ Rights Act
The Renters’ Rights Act changes the operational model, not the economics. The Act, which takes effect on 1 May 2026, abolishes Section 21 no-fault evictions, converts all tenancies to rolling Assured Periodic structures, and introduces civil penalties of up to £40,000 for serious breaches. Landlords who have operated informally or relied on Section 21 as a management backstop face the heaviest adaptation burden. Landlords with structured operations, compliant documentation, and stable tenancies are less affected.
Rental demand
Rental demand has never been stronger. Propertymark data shows approximately 118 new applicants registered per lettings branch against an average of 11 available properties. That 10:1 demand-to-supply ratio is structural. It is driven by net migration, homeownership affordability constraints, and landlord exits reducing available stock. Rental demand is not expected to ease materially before the 2030s.

These four factors together create a differentiated picture. The financial case for selling is strongest for leveraged, higher-rate taxpayers with low-yielding properties in personal ownership. The financial case for holding is strongest for mortgage-free or low-LTV landlords with strong-yielding, compliant properties, regardless of where those properties are held.
Why Most Portfolio Landlords Are Not Facing a Binary Choice
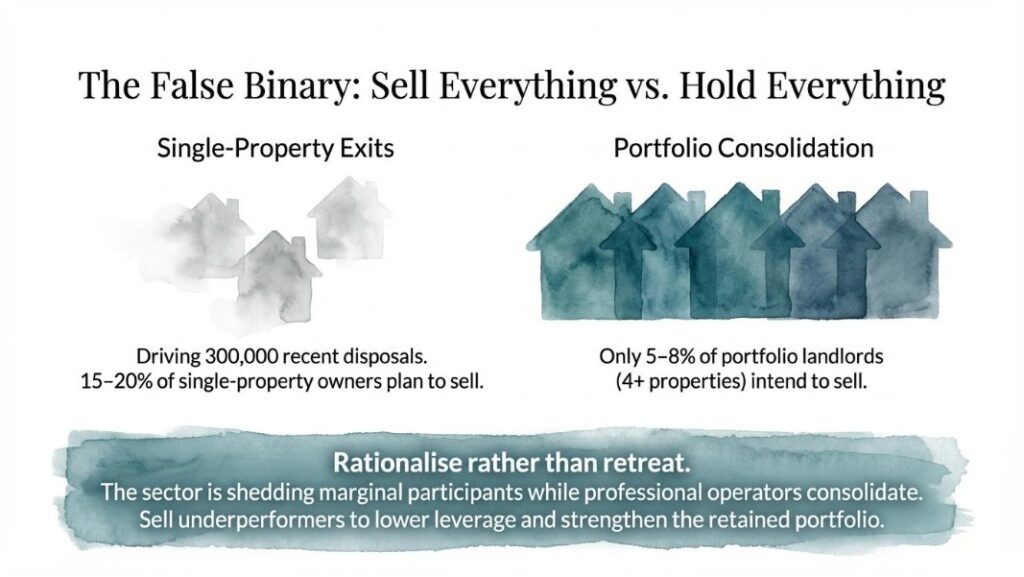
The narrative of a mass landlord exodus is partially accurate. Approximately 300,000 former rental properties were disposed of by landlords in 2023, and NRLA surveys show around 35% of landlords planning to reduce their portfolios. But this data requires context.
The exits are disproportionately driven by single-property and accidental landlords. Paragon Bank research consistently shows that only 5–8% of portfolio landlords (those with four or more properties) intend to sell, compared with 15–20% of single-property owners. The sector is not contracting uniformly. It is shedding its most marginal participants while professional operators consolidate.
This is precisely the environment in which portfolio rationalisation delivers the highest value. A landlord who sells one underperforming property and uses the proceeds to reduce leverage on two retained properties ends up with a smaller but significantly stronger portfolio. Lower LTV improves cash flow, reduces Section 24 exposure, improves stress-test resilience, and positions the portfolio better for future refinancing.
The question for most portfolio landlords in 2026 is not “should I sell everything?” It is: “which properties in this portfolio are working, and which are not?”
The Four-Factor Assessment Framework
Use the following four factors to assess each property individually. A property that scores poorly across multiple factors is a disposal candidate. A property that scores well across all four is a hold.
Factor 1: Net yield and cash flow
Net yield is the clearest measure of whether a property is earning its place in a portfolio. Calculate it by subtracting all annual costs (mortgage interest, management fees, insurance, maintenance, void allowance, compliance costs) from gross rental income, then divide by current market value. Use the Letsana Rental Yield Calculator to run this figure for each property.
A net yield below 3% after all costs should prompt a serious review. At that level, the cash return on equity is likely to be lower than available alternatives. A net yield above 5% represents a strong hold position in most market conditions.
The cash-on-cash return matters too. If a property requires £80,000 in equity and generates £3,200 per year after costs, the cash return is 4%. Compare this to other uses of that capital before concluding it represents the best deployment.
Factor 2: Tax efficiency of ownership structure
The ownership structure determines how heavily income is taxed. A property held personally by a higher-rate taxpayer with a 75% LTV mortgage will typically generate a substantially worse after-tax return than the same property held in a limited company, or the same property held personally but mortgage-free.
Limited companies can deduct mortgage interest in full as a business expense and pay corporation tax at 19–25% rather than income tax at up to 45%. For new purchases, limited company ownership is now the dominant model, representing approximately 50–60% of all new buy-to-let mortgage applications. For existing personally-held properties, the cost of transferring to a company (CGT on disposal plus SDLT on company acquisition) typically makes retrospective incorporation unviable unless embedded gains are minimal.
For higher-rate taxpayers with high LTV mortgages in personal ownership, the structural tax position is the most important factor in the sell-or-hold decision. No amount of rental growth resolves a fundamental tax inefficiency.
Factor 3: Compliance readiness and regulatory cost
The Renters’ Rights Act introduces ongoing obligations rather than one-time compliance costs. Under the new regime, possession requires evidence-based grounds under Section 8. The first 12 months of a tenancy carry a protected period during which Ground 1 (occupation) and Ground 1A (sale) cannot be used, creating a minimum 16-month effective holding period before possession can be sought. Rent arrears require three months before mandatory Ground 8 can be activated.
For properties with stable long-term tenants and structured management, these changes are manageable. For properties with a history of frequent tenant turnover, or those where Section 21 has been used as a routine management tool, the new framework increases holding risk.
The EPC timeline is also a compliance cost that differs by property. A Band C property requires no capital expenditure before the October 2030 deadline. A Band E property requiring £10,000 in upgrades is a different proposition, particularly if that cost is being weighed against a disposal decision.
Factor 4: Capital growth outlook
Not all properties appreciate at the same rate. Location, property type, local employment trends, and infrastructure investment all influence long-term capital growth. Savills projects cumulative UK house price growth of approximately 17–22% over 2025–2029, with Northern regions expected to outperform in percentage terms. A property that is growing in value at 4% per year is building equity that may offset modest yield returns. A property in a stagnant market with low yield and poor compliance ratings offers neither.
Capital growth also affects the CGT calculation at exit. A property bought at £180,000 and now worth £320,000 carries an embedded gain of £140,000. After the £3,000 exemption, a higher-rate taxpayer would pay approximately £32,400 in CGT at the current 24% rate. That liability does not go away by holding. It increases as values rise. The question is whether future income and growth justify deferring it.
Use the Buy-to-Let Decision Score Calculator
The decision framework above produces a qualitative assessment. The financial position requires precise calculation: net yield, after-tax cash flow, CGT liability, selling costs, and the comparison between holding and disposing.
The Letsana “Should I Sell My BTL Property?” calculator models these variables using your specific figures. It applies current CGT rates (18% basic rate, 24% higher rate), the £3,000 annual exemption, and your ownership cost structure to produce a clear comparison between holding and selling.
Regional Yield Context: Where Properties Are Working
One of the most consistent findings across portfolio landlord data is that yield performance varies significantly by region. A property in the North East generating 7.5–8.5% gross yield occupies a very different strategic position than a property in London generating 3.5–5.0% gross yield, even if both are fully tenanted.
Approximate gross yield ranges by region (based on Zoopla, Paragon Bank, and Fleet Mortgages indices):
| Region | Approximate Gross Yield |
|---|---|
| North East | 7.5–8.5% |
| North West | 6.5–7.5% |
| Yorkshire and Humber | 6.5–7.5% |
| East Midlands | 5.5–6.5% |
| West Midlands | 5.5–6.5% |
| South West | 4.5–5.5% |
| South East | 4.0–5.0% |
| London | 3.5–5.0% |
These figures are gross. Net yields are typically 1.5–2.5 percentage points lower after voids, management, maintenance, insurance, and compliance costs. A property generating 4% gross in the South East may net 1.5–2.5% after costs, making it extremely difficult to justify on income grounds alone.
For portfolio landlords with Southern properties generating sub-3% net yields, the regional arbitrage case is compelling. Sale proceeds from a £400,000 South East property could fund two higher-yielding Midlands or Northern properties within a limited company structure, generating materially stronger after-tax cash flow from day one.

The Sell Signal and the Hold Signal: A Summary Framework
Properties that represent strong disposal candidates share several characteristics. Net yield below 3% after all costs. High LTV mortgage held in a personal name by a higher-rate taxpayer. EPC rating of D or below requiring capital expenditure before 2030. Location with weak tenant demand or limited capital growth prospects. History of management complexity or arrears. Holding these properties costs more than the return justifies.
Properties that represent strong hold positions also have identifiable characteristics. Net yield above 5%. Low LTV or mortgage-free. EPC Band C or above. Strong local rental demand with multiple applicants per listing. Limited company ownership or basic-rate personal ownership. Stable long-term tenants. These properties are generating cash, building equity, and carrying manageable regulatory exposure.
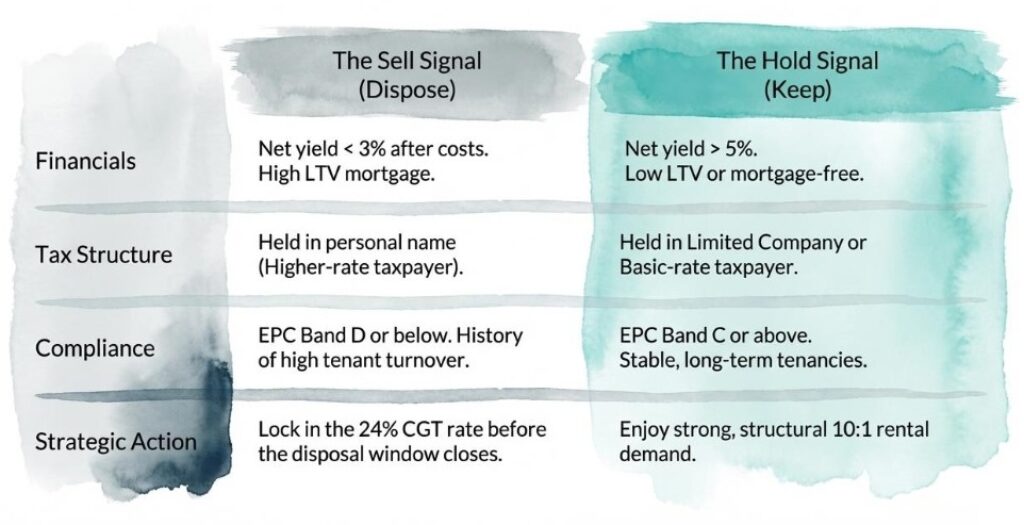
Most portfolios contain both types. The discipline is in distinguishing between them rather than treating the portfolio as a single decision.
The 2026 Position: What the Data Supports
Three conclusions follow from the available data.
First, 2026 is a rational time to dispose of underperforming properties. The CGT rate is at its most favourable level since 2016. The regulatory environment is stepping up in complexity from May 2026 onwards. Properties that are already struggling to justify their position will face higher compliance costs and no improvement in their structural tax disadvantage.
Second, 2026 is not the time to exit strong-performing assets. Rental demand is at historically elevated levels. Rents are growing at approximately 3–7% annually depending on the data source. The rental supply deficit of approximately 500,000+ homes relative to demand is structural and unlikely to resolve in the near term. Landlords who exit high-yielding, compliant properties will find re-entry expensive and the market more competitive.
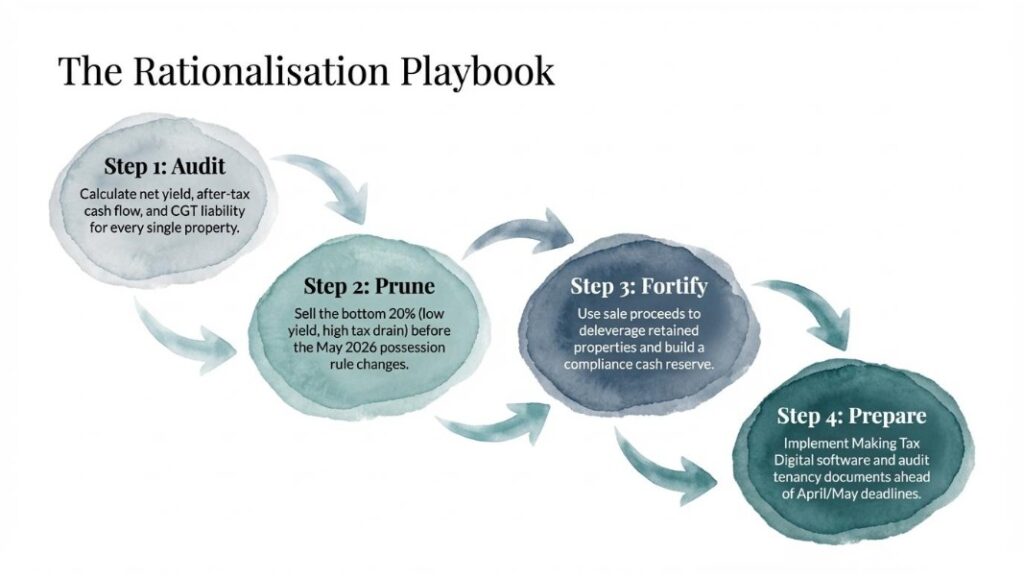
Third, the strongest strategy for most portfolio landlords is selective rationalisation rather than wholesale disposal or passive retention. Sell the weakest 20% of the portfolio. Use proceeds to reduce leverage on retained properties. Build a cash reserve. Bring retained properties to full compliance ahead of May 2026. The result is a smaller, more resilient, and more tax-efficient portfolio positioned for the next regulatory cycle.
What Comes Next
The regulatory calendar for 2026 runs at pace. MTD ITSA begins on 6 April. Day Zero for the Renters’ Rights Act is 1 May. The deadline to issue Written Statements to existing tenants is 31 May. The PRS Database and mandatory Landlord Ombudsman are expected later in the year.
Portfolio decisions made before May 2026 will play out in a different compliance environment than those made after. For landlords actively considering disposal, the window between now and the end of April allows decisions to be completed before the new tenancy framework makes possession timelines longer and less certain.
For landlords who are holding, the priority is compliance preparation: MTD registration, tenancy document audit, EPC assessment, and cash reserve planning.
The landlords who will find 2026 manageable are those who have assessed each property on its own terms and have a clear operational system for what follows. Property management is becoming more structured. The portfolios that are built around that reality will perform better than those that are not.
Use the Letsana “Should I Sell My BTL Property?” calculator to run the numbers on each property in your portfolio, including CGT liability, net yield, and after-tax cash flow comparison.

Recommended Reading:
1. Renters’ Rights Act: What Landlords Need to Know Before 1 May 2026
2. Making Tax Digital for Landlords: The April 2026 Guide
3. EPC Band C: What Landlords Need to Know
4. Local Authorities and the Renters’ Rights Act